Reflections on a Data Visualization Workshop: Understanding Gen Z’s Consumer Habits
Participating in the data visualization workshop was an eye-opening experience. As someone who enjoys both design and research, I found it fascinating to see how raw data could be transformed into a compelling visual story. Instead of just looking at numbers on a spreadsheet, we learned how to structure information in a way that makes it both digestible and engaging.
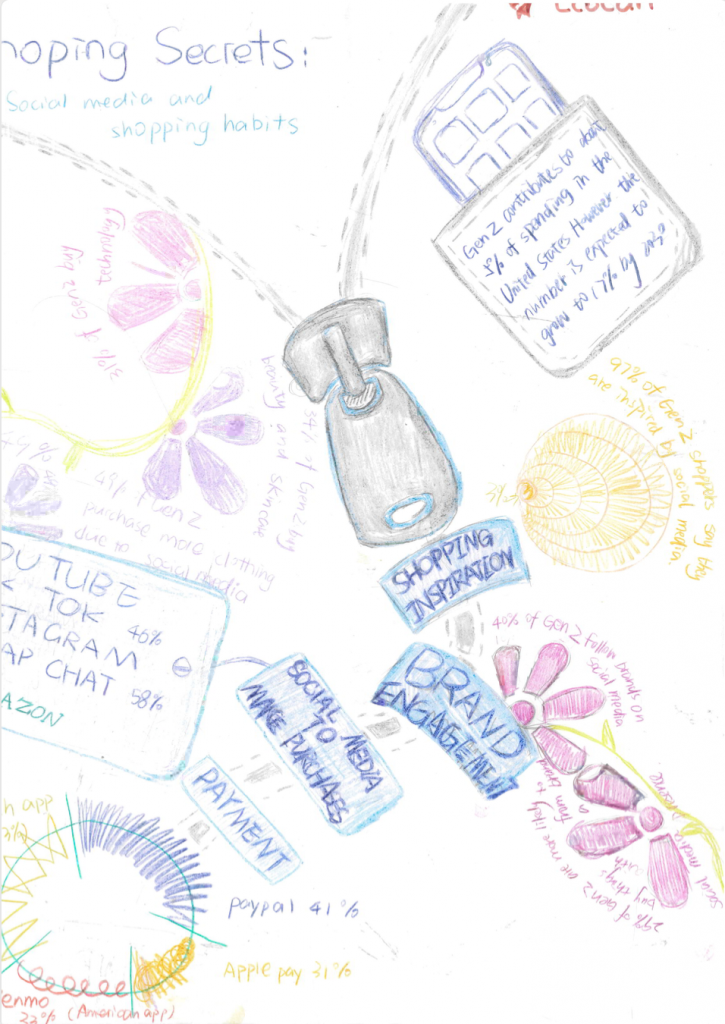
For our project, we focused on Gen Z’s shopping behavior. The statistics we worked with revealed not only their current spending habits but also how social media is shaping their purchasing decisions. One of the most striking insights was that 97% of Gen Z shoppers take inspiration from social media, proving just how crucial influencer marketing has become. Additionally, we discovered that traditional e-commerce platforms like Amazon are losing appeal among younger consumers, as more of them are making purchases directly through TikTok, Instagram, and Snapchat.
Another interesting trend was the contrast between online and offline shopping preferences. While Gen Z is heavily influenced by social media, 81% still enjoy in-store shopping, especially when they want to physically experience a product. This finding challenges the assumption that digital natives prefer purely online experiences—many still value the tactile aspect of shopping.
In creating our data visualization, the challenge was to translate these trends into a clear, visually engaging format. We experimented with different ways to present the data, ensuring that the relationships between numbers and behaviors were easy to interpret. The process made me appreciate how much design choices—like color, layout, and hierarchy—affect the way information is understood.
Ultimately, this workshop reinforced the power of data visualization as a bridge between information and understanding. Numbers alone can feel overwhelming, but when structured effectively, they tell a story. Through this project, I not only deepened my understanding of Gen Z’s consumer habits but also gained valuable skills in presenting data in a way that is both informative and visually compelling.
Below are some snapshots of our process and final visualization: